Designing an Admin Dashboard for Operation and Fleet Management
UI/UX Design
Website Design
Web App Design
Client Name:
Lightfields
Principal Designer
Rashid Alowaisheer
CHALLENGES
Disorganized Performance Metrics
Missing Customer Support Access
Fragmented Subscriber Data
Inventory Management Gaps
Inefficient Fleet Management
Fragmented Subscriber Data
Managing subscriber data was a persistent challenge for the admin team, largely due to the dashboard’s lack of structure. Key information such as addresses, contact details, and dietary restrictions was not easily accessible or editable in one place.
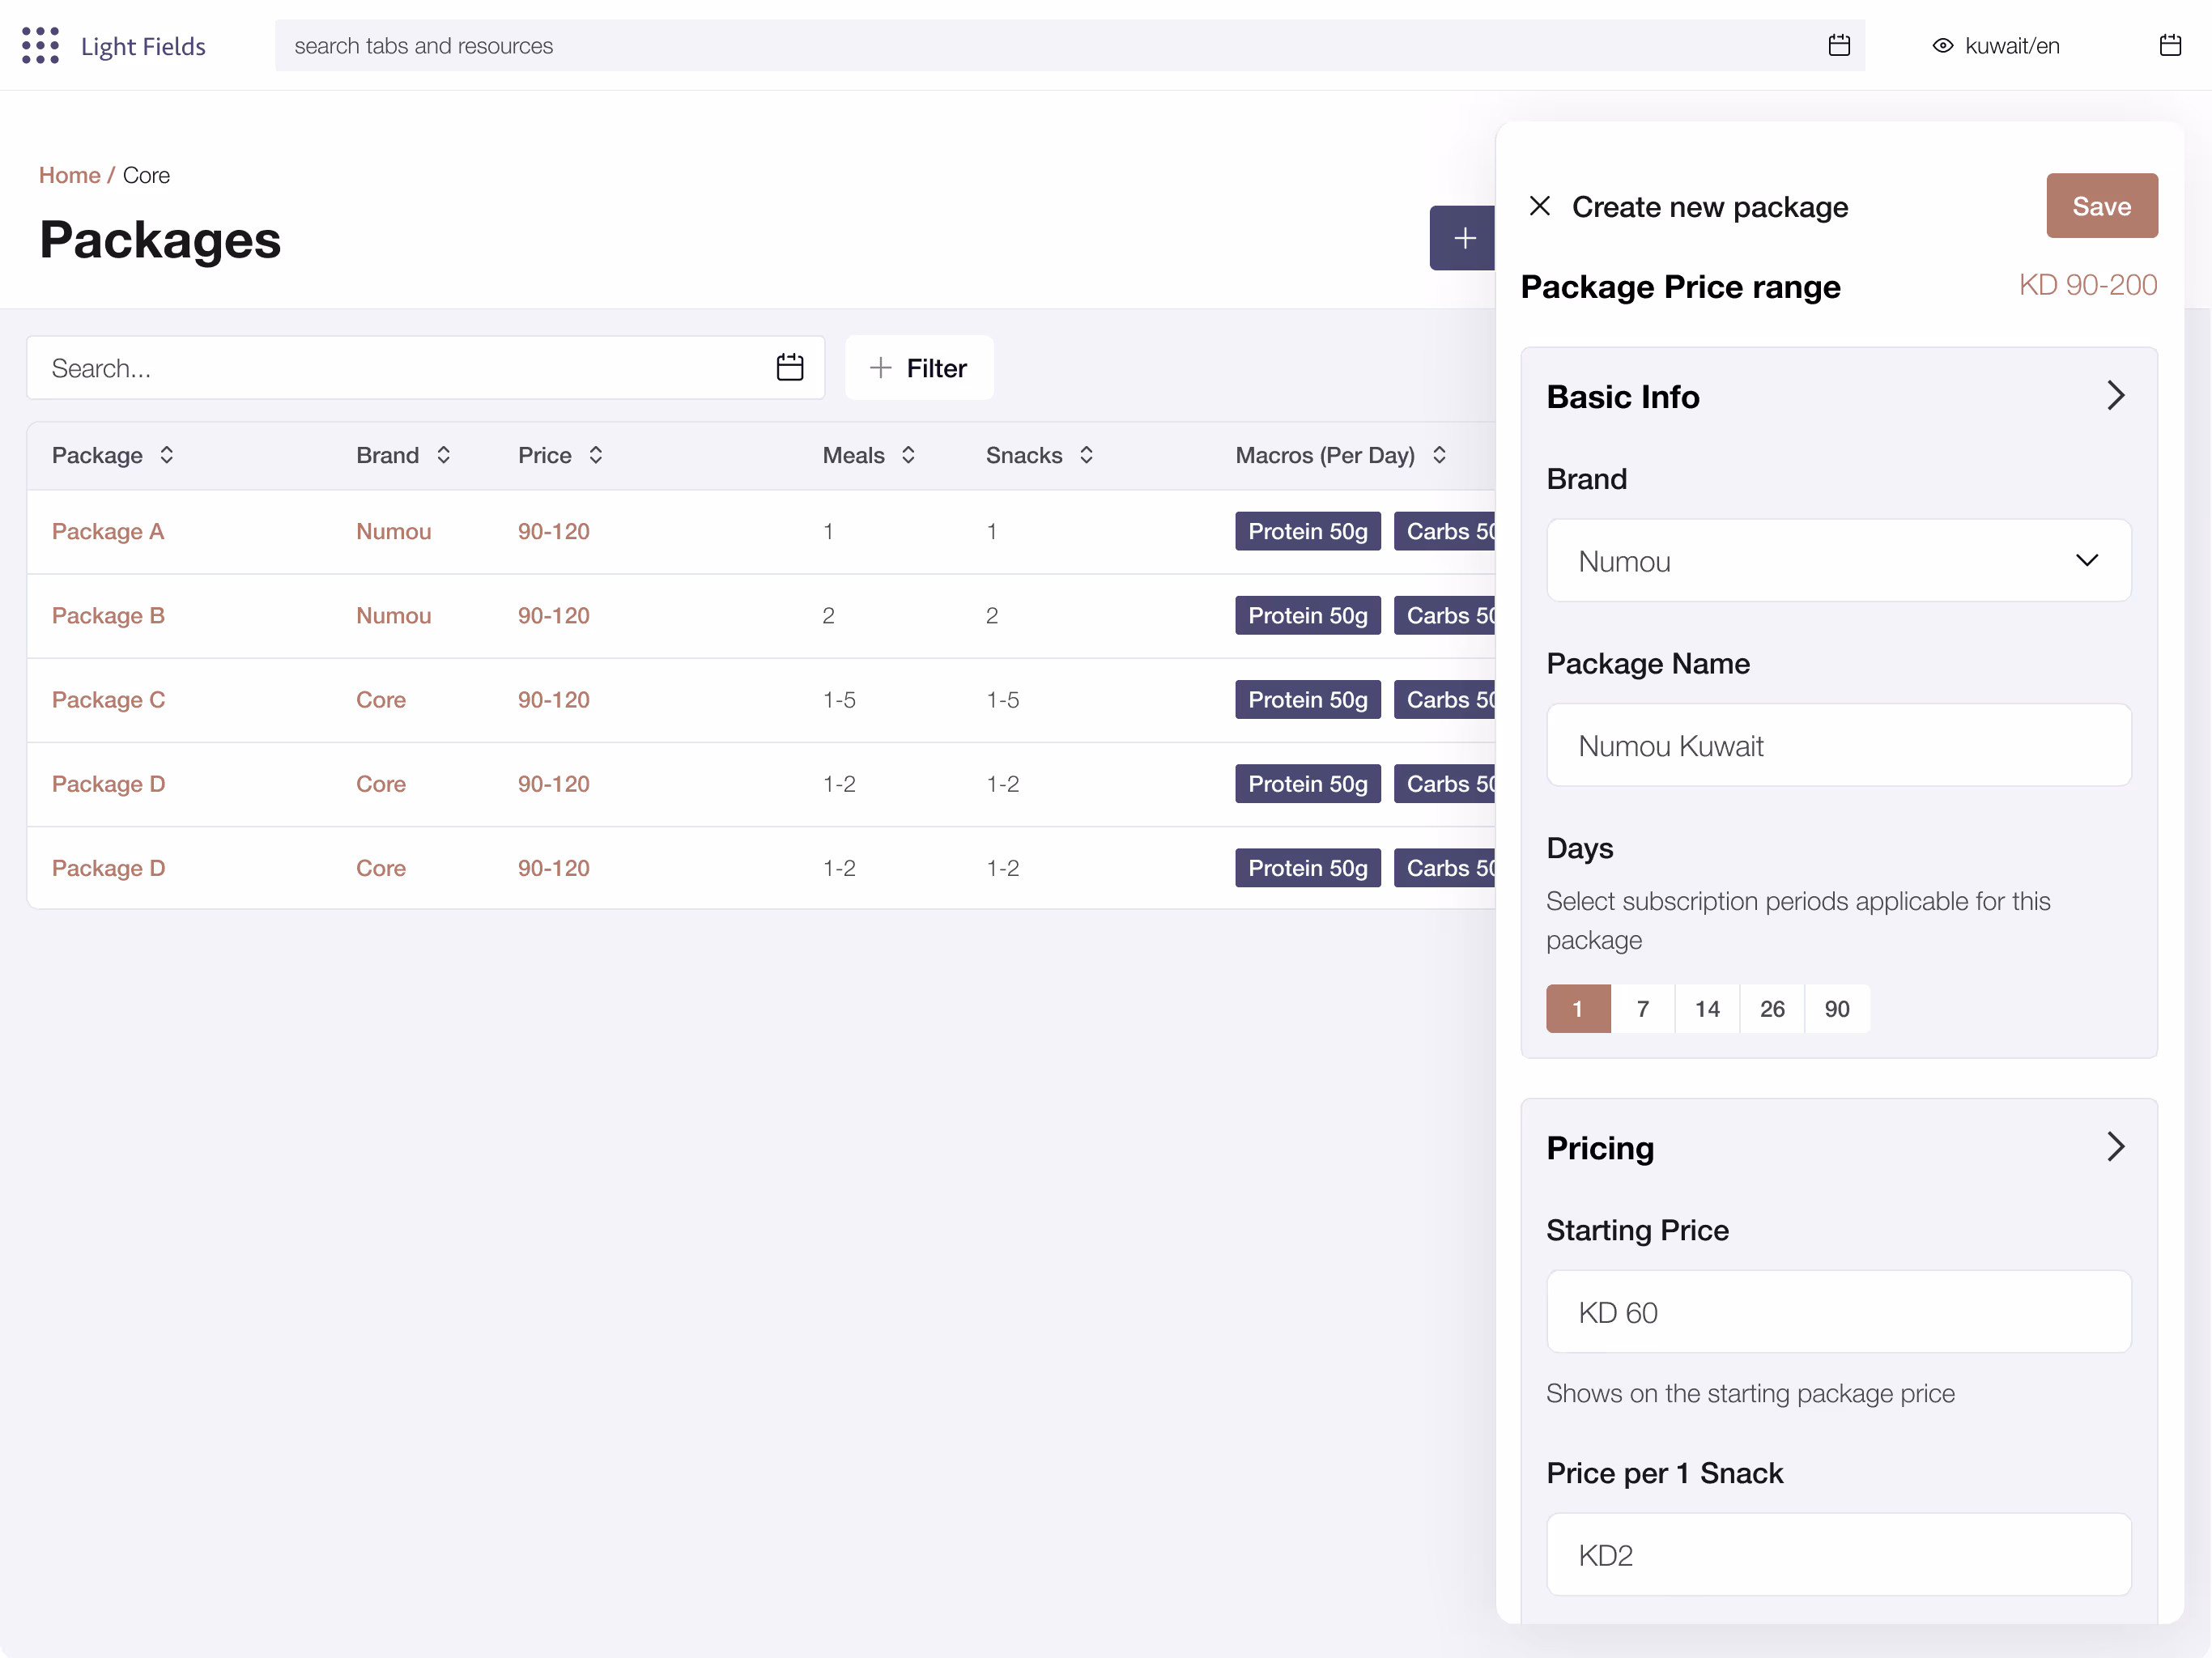
Inventory Management Gaps
The absence of a clear system for tracking inventory levels of ingredients and meals created bottlenecks in planning and preparation. Teams had to rely on manual tools to monitor stock, which increased the risk of errors, over ordering, or running short on essential items.
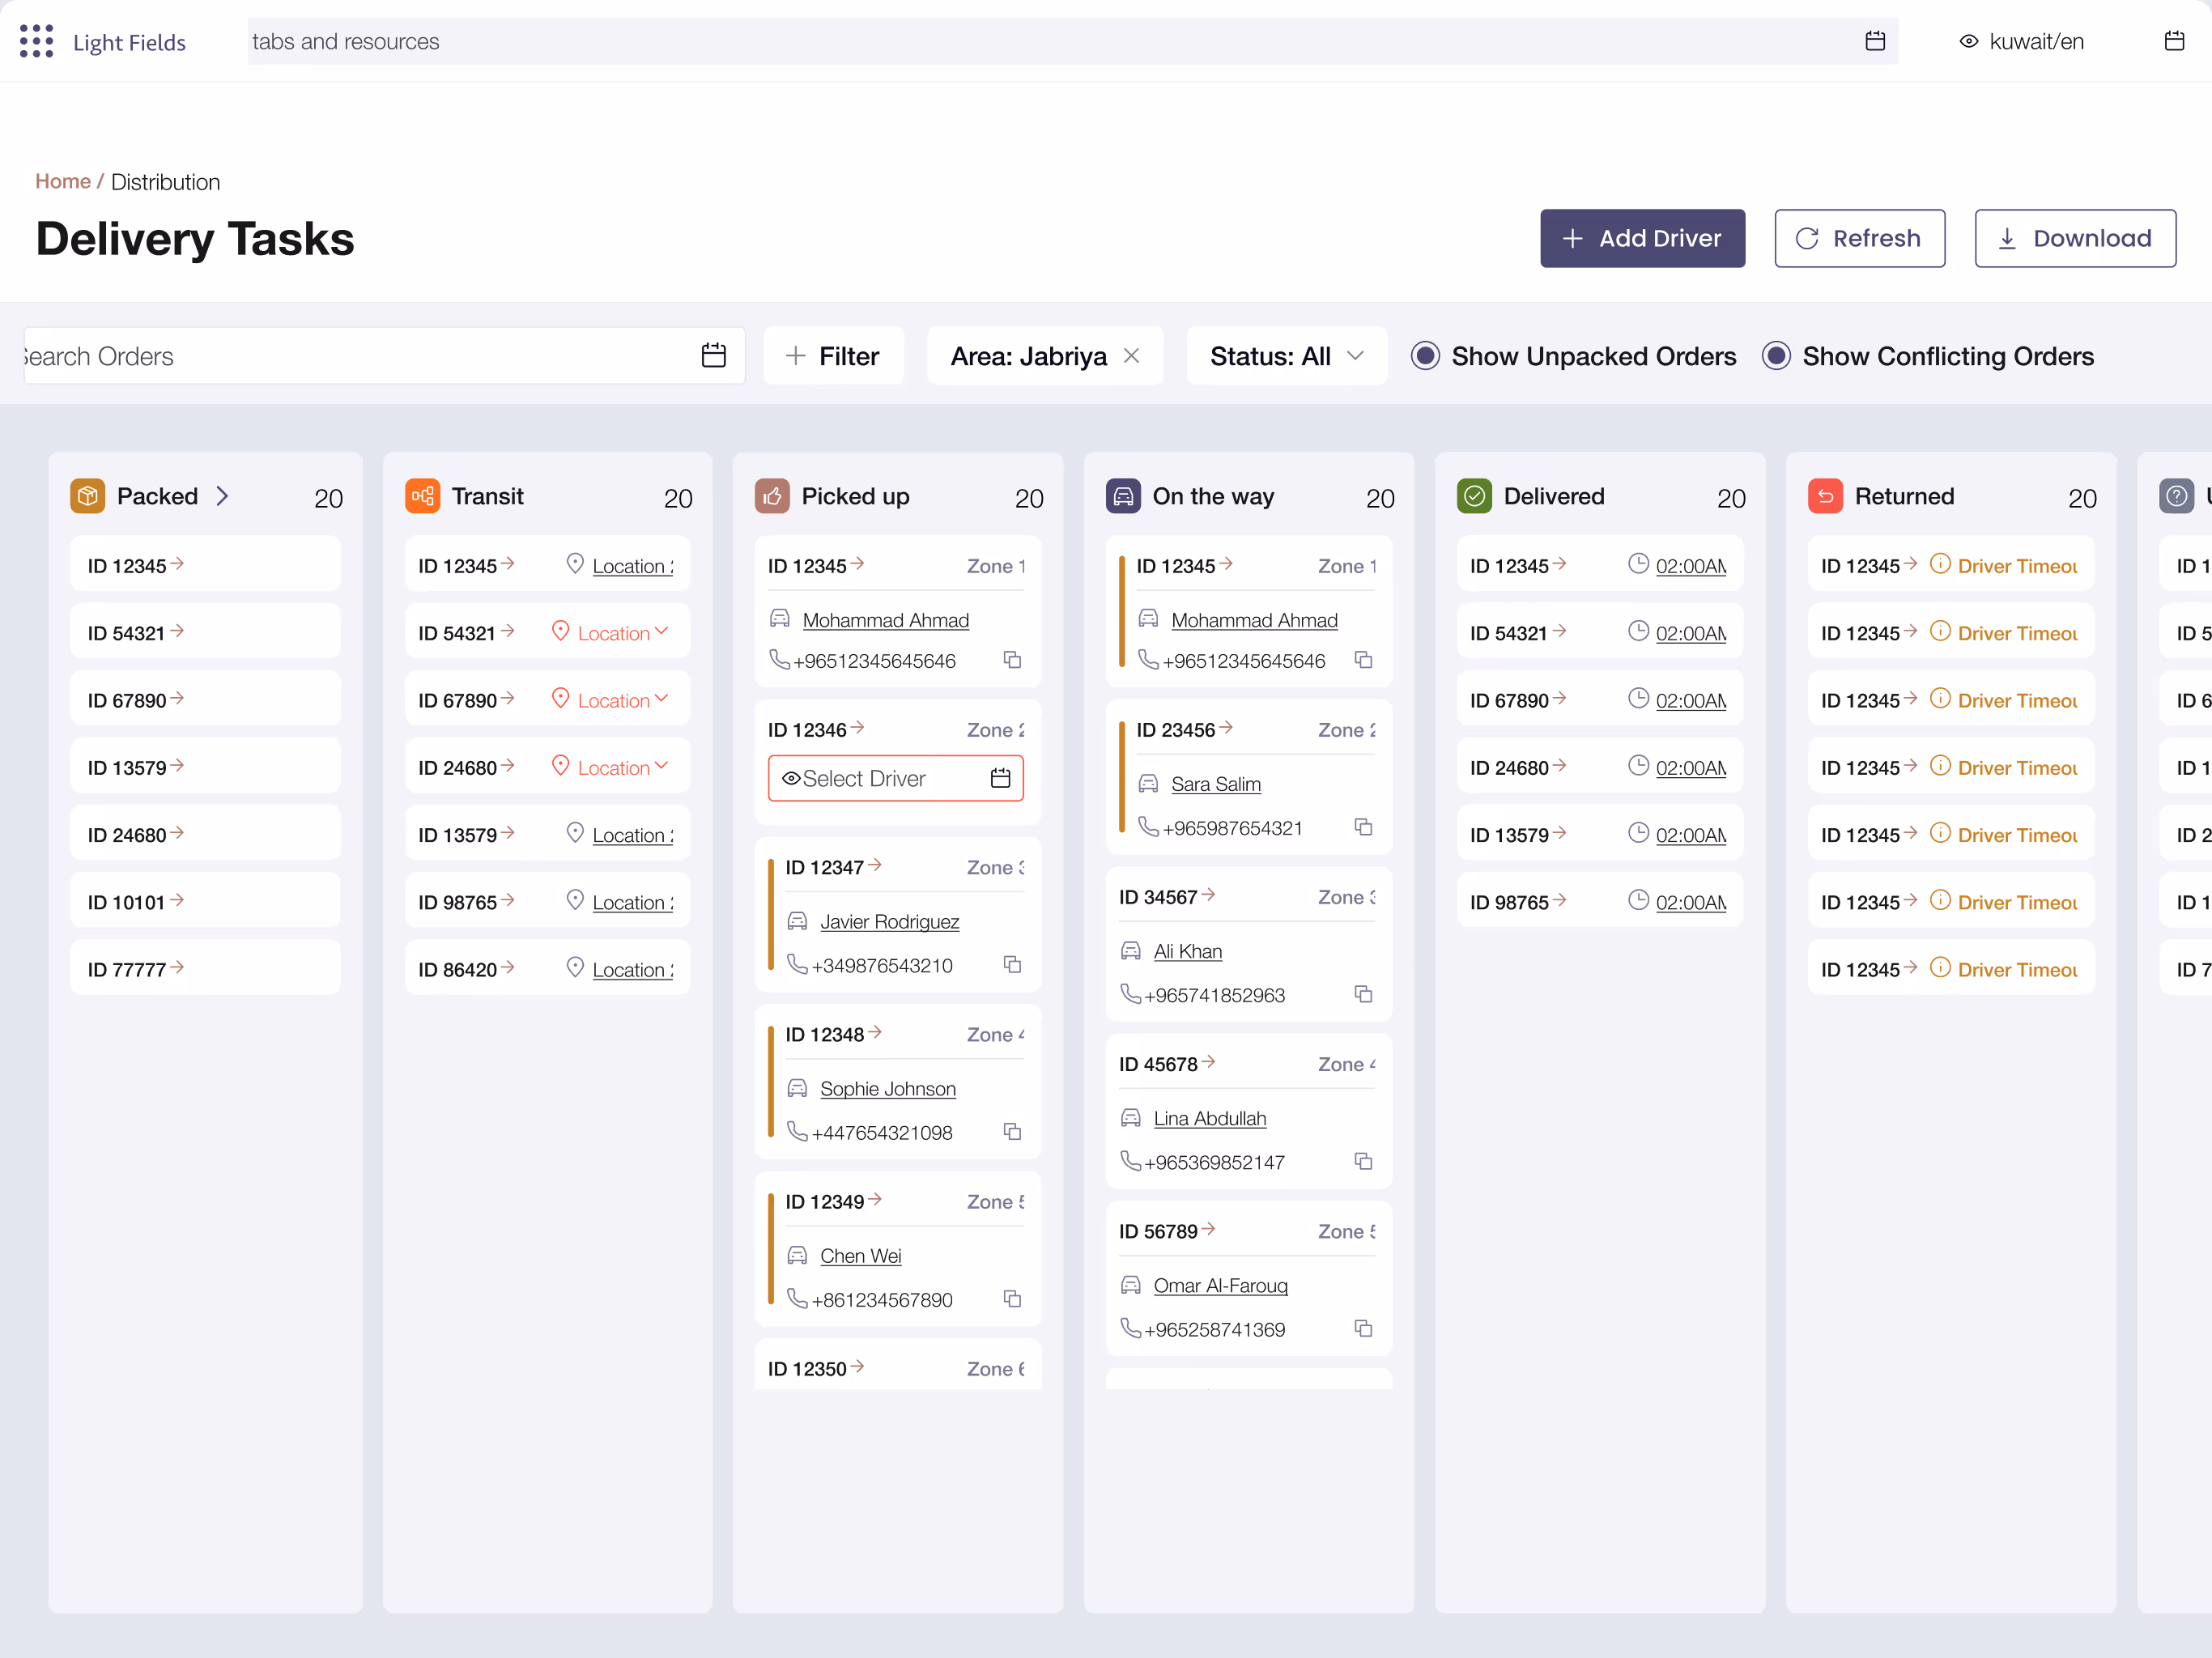
Inefficient Fleet Management
The existing dashboard failed to support the admin team’s needs for real time visibility into fleet activity. The seven critical stages of the delivery process, spanning from packing to final delivery, were scattered across multiple disconnected sections and handled by different team members. This made it difficult to track progress across the delivery stages leading to delays, miscommunication, and limited accountability.
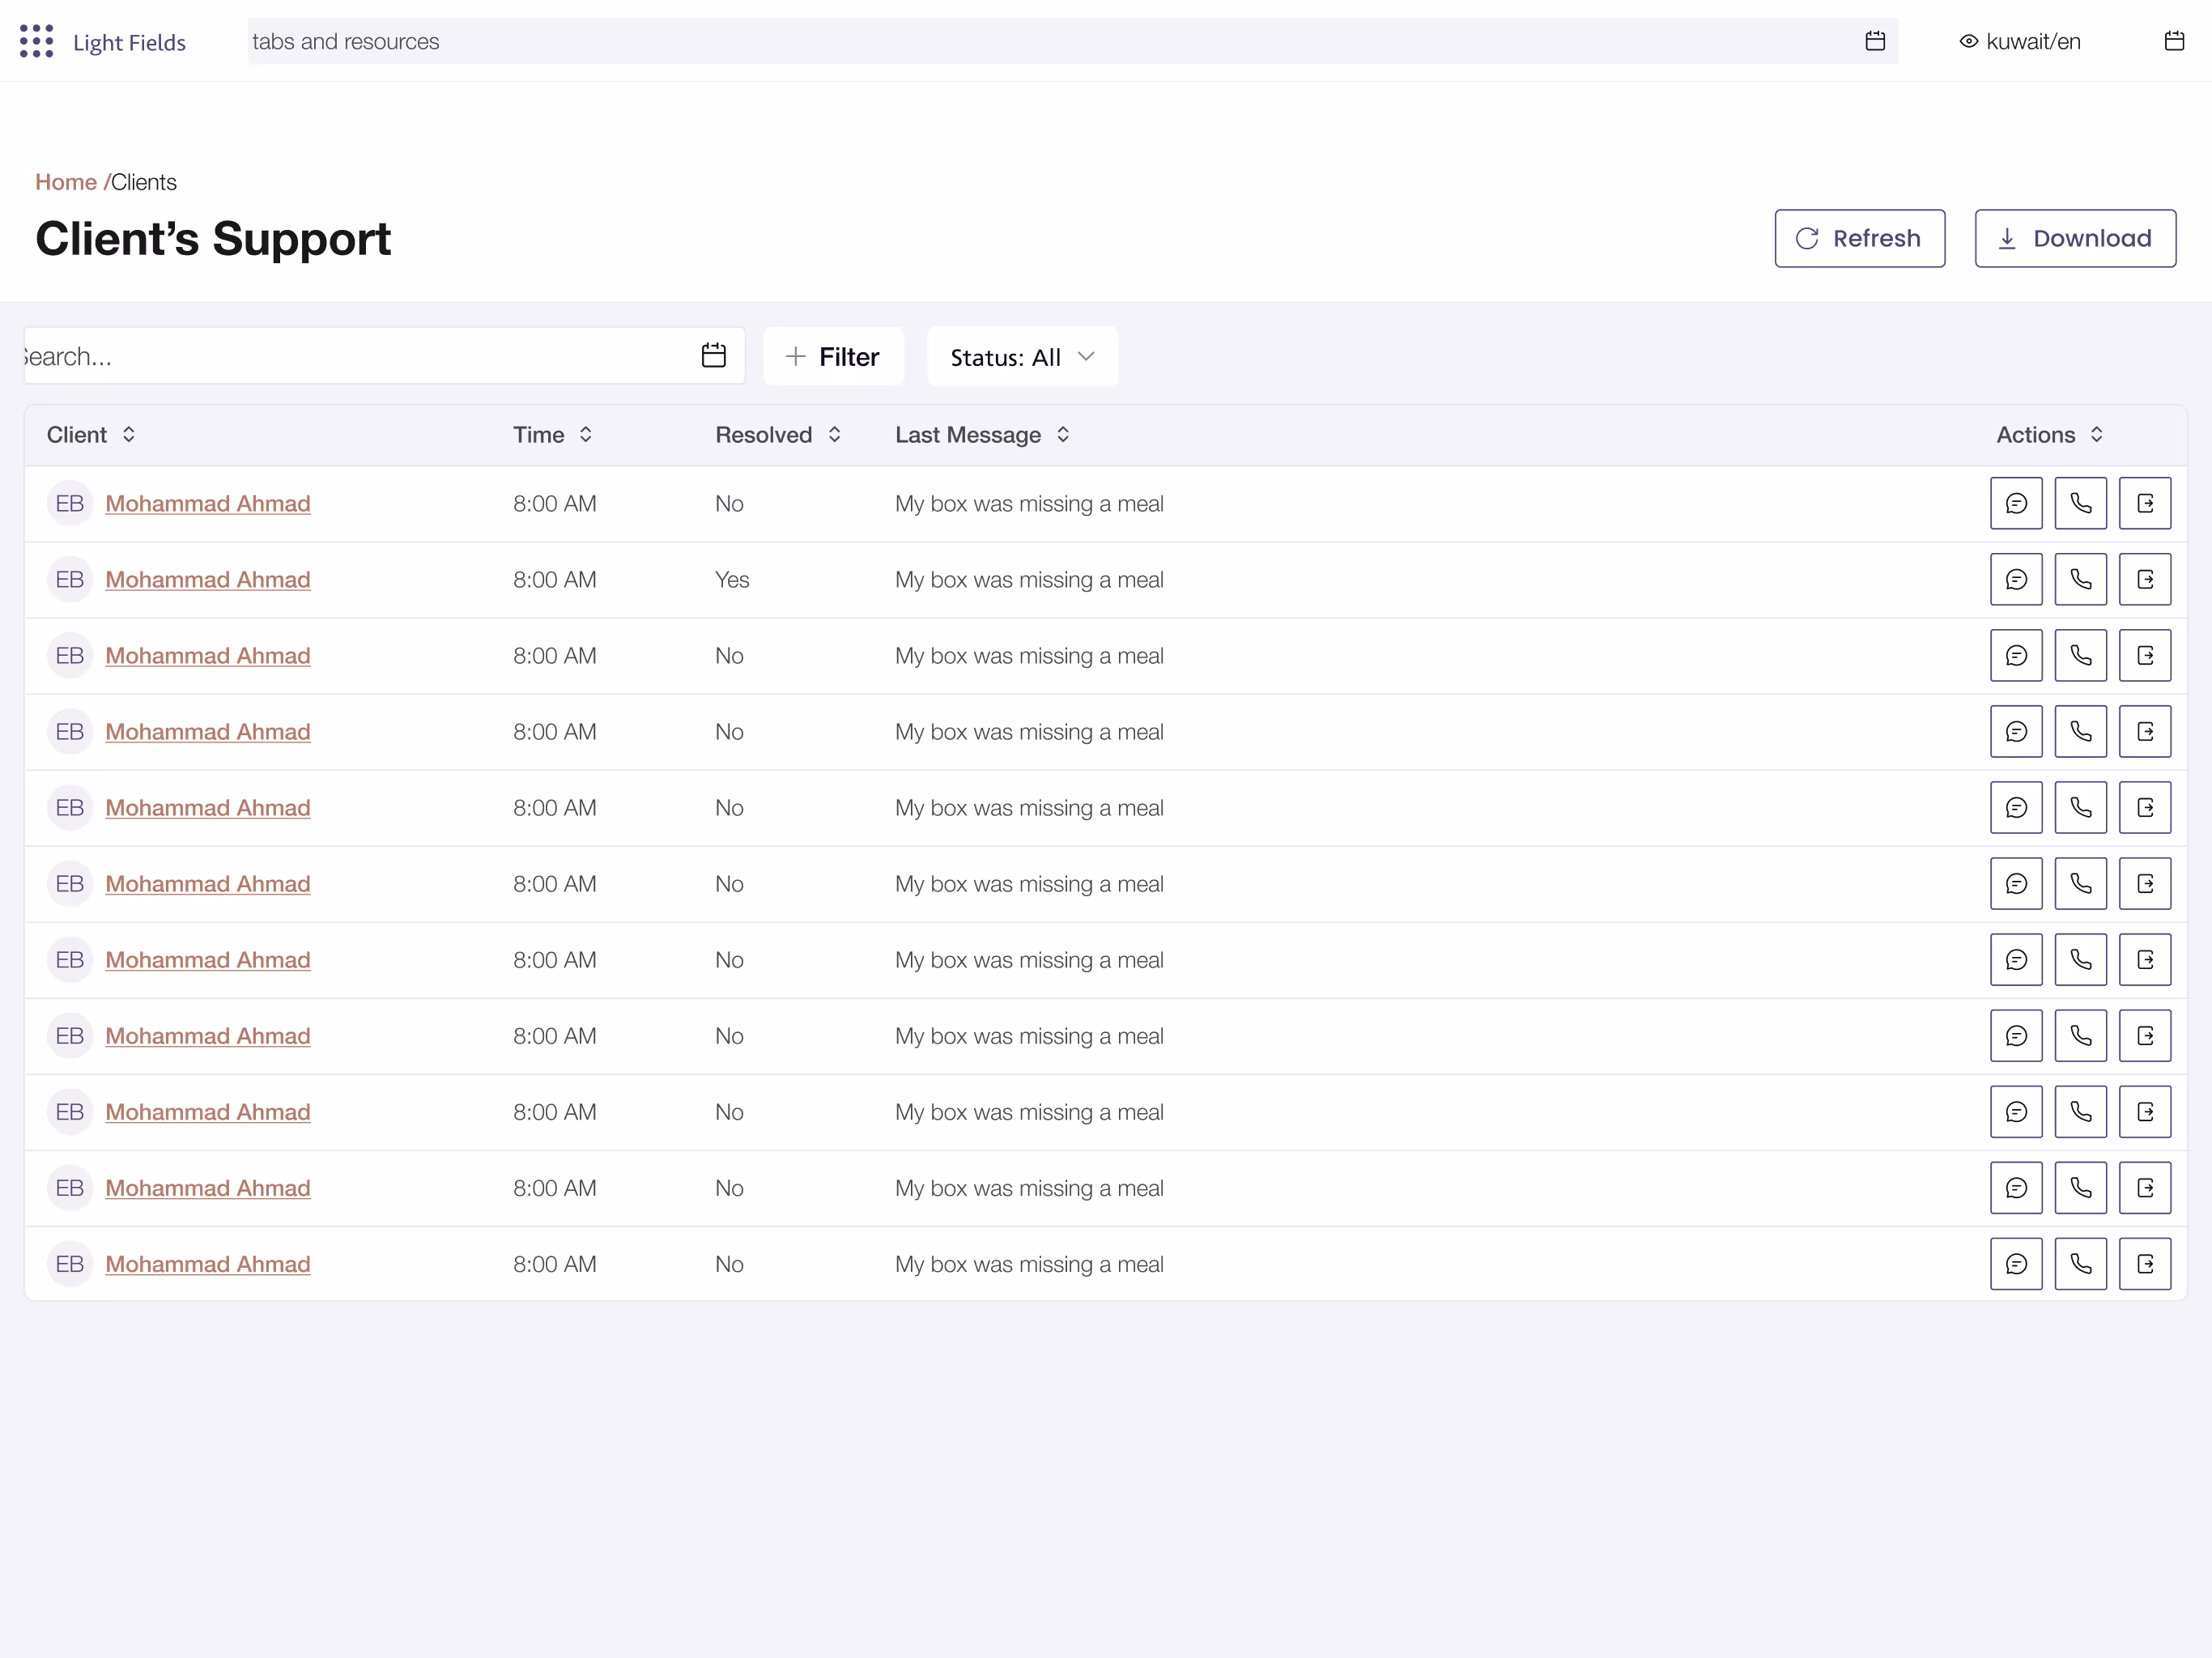
Missing Customer Support Access
The customer support team lacked a dedicated space within the dashboard to access and manage subscriber information. Without the tools to handle requests directly within the system, they had to rely on manual coordination with other teams. This slowed response times, and increased the risk of miscommunication
Disorganized Performance Metrics
Unclear and poorly organized analytics limited the team’s ability to extract actionable insights and identify issues.
PROCESS
Data Visualization
Rapid Prototyping
1
Data Visualization
Insights from operational activity were mapped out to understand how the team interacted with key information. This helped identify which data needed to be most visible and how to present it in a way that supported faster decision making and a streamlined workflow.
2
Rapid Prototyping
Interactive mockups were created to simulate key user flows, such as managing subscribers, tracking performance metrics, and overseeing the delivery process. This allowed the team to give early feedback and helped identify usability issues before development.
SOLUTIONS
Consolidated Subscriber Data
Structured Inventory Management
Actionable Performance Metrics
Integrated Admin Web App
Integrated Customer Support Channel
Consolidated Subscriber Data
A subscriber management system was introduced within the dashboard, allowing the team to easily view, update, and filter customer information in one place. This included personal details, delivery preferences, and dietary restrictions. By consolidating scattered data, the team could now respond faster to customer needs and reduce errors.
Structured Inventory Management
Inventory tracking for meals and ingredients was brought into a dedicated section within the dashboard. Teams could monitor stock levels, ingredient usage, and upcoming menu requirements more efficiently. The structured system replaced manual tracking methods and reduced the risk of over ordering or running out of key items.
Actionable Performance Metrics
Disorganized data was replaced with a set of clear, visual performance metrics tailored to operational goals. Key indicators such as delivery completion rates and subscriber trends were presented through charts and summaries that were easy to interpret at a glance. This enabled the team to promptly identify problems and make informed decisions.
Integrated Admin Web App
A dedicated admin web app was developed to bring structure and real time visibility to the different stages of delivery. The app's visually organized interface streamlined the delivery workflow and improved overall fleet management.
Integrated Customer Support Channel
A customer support channel was built into the dashboard, giving support staff access to subscriber profiles and the ability to manage subscriptions directly. Tasks like pausing or renewing accounts, logging allergies, or updating delivery addresses could now be handled instantly. This eliminated the need for back and forth coordination with other teams and improved the speed and quality of customer service.